
Enterprise AI agent programs that fly on the wrong metrics make expensive decisions on incomplete evidence. These programs attempt to expand agent authority when escalation rates mask accuracy problems, declare programs successful when task completion rates hide partial-execution failures, and miss model drift until it has already degraded business outcomes.
The measurement frameworks built for conventional AI classifiers and generative models do not transfer cleanly to agentic systems, where the failure modes span tool-use errors, multi-step reasoning breakdowns, escalation-calibration gaps, and latency that compounds over dozens of sequential actions.
RTS Labs builds evaluation architecture into every enterprise agent deployment, and this guide covers the metrics, benchmarks, and instrumentation practices that production programs rely on to remain reliable and improve over time.
Why Standard AI Metrics Fall Short for Agentic Systems
Accuracy tells you almost everything you needed to know about a document classifier. But it tells you almost nothing about whether an agent completed the right task, used the right tool, took the right number of steps, and left the connected systems in the right state.
1. What makes agent evaluation fundamentally different
The core problem is that standard AI evaluation assumes a function with one input and one output. An agent is a process with one goal, many intermediate decisions, many tool calls with real-world side effects, and a completion state that may be correct, partially correct, or incorrect in ways that a binary success/fail label cannot distinguish.
Five specific characteristics of agentic systems require evaluation approaches that conventional metrics were not designed to handle.
- Multi-step task completion vs. single-output scoring: a classifier either classifies correctly or does not; an agent may complete eight of ten required steps correctly, fail on step nine, and produce an output that looks superficially correct but is built on an incomplete execution. Scoring the final output without evaluating step-level completion misses the most common category of agent failure in production.
- Tool use and side effects: when an agent calls a tool, the action has real consequences that persist after the task ends. An evaluation framework that scores only the agent’s text output and ignores the state of connected systems after task execution is measuring the wrong thing entirely.
- Non-deterministic execution paths: the same goal presented to an agent on two different occasions may produce two different sequences of tool calls and intermediate decisions, both of which arrive at a correct final state. Evaluation approaches that compare agent outputs to a single ground-truth execution path penalize valid alternative solutions and understate the true accuracy.
- Human-in-the-loop interactions: the quality of an escalation is an evaluation dimension that has no equivalent in conventional AI systems. A program that measures escalation rate without measuring escalation accuracy is missing half the picture.
- Time-to-completion as a first-class metric: latency in a single-output model is a system performance metric; latency in an agent is partly a system metric and partly a workflow quality metric. An agent that completes a ten-step task correctly in thirty seconds is different from one that completes the same task correctly in four minutes, and the difference matters for the operational value the deployment delivers.
2. The three layers of agentic AI evaluation
A complete evaluation framework measures agent performance at three layers simultaneously. Each layer answers a different question, and the absence of any one layer creates a specific blind spot that manifests as an unexplained production problem.
- Component-level metrics measure the performance of individual agent components in isolation, including the accuracy of the extraction function for a specific document type, the error rate of a specific application programming interface (API) integration, and the confidence calibration of the decision model for a specific case category. Component-level metrics identify where in the workflow failures originate, which is essential for root cause analysis when end-to-end metrics degrade.
- Workflow-level metrics measure the performance of the complete agent workflow from goal receipt to task completion, including task success rate, end-to-end latency, escalation rate, tool call efficiency, and the quality of handoff information for escalated cases. These are the metrics that operational teams monitor in production and that appear on program dashboards.
- Business outcome metrics measure the impact of agent performance on the operational KPIs the deployment was designed to improve — cost per completed transaction, first-contact resolution rate, processing time per case, error rate, and other downstream outputs. The deployment was designed to improve. Business outcome metrics are the layer that connects agent behavior to business value and that stakeholders outside the technical team need to see to maintain confidence in the program.
Also Read: The 7 Core Layers of an Enterprise-Ready Agentic AI Architecture
Core Agentic AI Evaluation Metrics and KPIs
These are the metrics that production enterprise agent programs instrument from day one. Each one corresponds to a category of production failure that consistently costs programs money, compliance standing, or stakeholder confidence when it goes undetected.
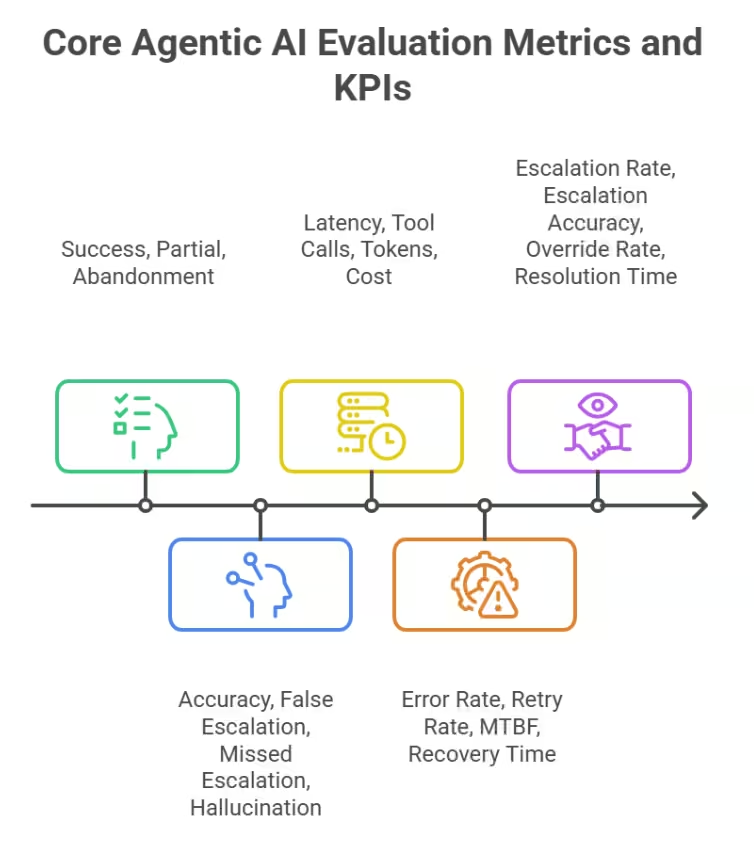
1. Task completion metrics
a. Task success rate
The percentage of tasks the agent completes correctly end-to-end, with all required steps executed, all required system states updated, and all required outputs produced to the standard defined in the workflow specification.
Target range: 90% or above for autonomously handled case types in production; programs below 85% should not operate at full volume.
Warning threshold: any two-week period showing a decline of three or more percentage points from the established baseline triggers a diagnostic review.
b. Partial completion rate
The percentage of tasks where the agent completes some but not all required steps before failing or escalating. A partial completion rate above ten percent indicates either that the workflow contains a step with a systematically higher failure rate than the others or that the agent’s planning and recovery logic is insufficient for the workflow’s complexity.
Target: below eight percent in production.
c. Task abandonment rate
The percentage of tasks the agent stops without completing and without producing an escalation to a human reviewer. These are the cases that fall into neither the success nor the escalation bucket. An abandonment rate above two percent indicates a gap in the agent’s error-handling architecture.
Target: below one percent; any non-zero abandonment rate in a production program should be investigated immediately.
- Accuracy and decision quality metrics
a. Decision accuracy rate
The percentage of autonomous agent decisions that match the ground truth established by human reviewer audit on a sampled case set. This is distinct from task success rate. Ground truth sampling should cover at least 5% of the total production volume for each review period.
Target: 92% or above on in-scope case types.
b. False escalation rate
The percentage of cases the agent escalates to a human reviewer that a qualified human reviewer would have resolved autonomously within the agent’s defined authority. False escalations above 15% indicate overly conservative confidence thresholds that reduce the operational efficiency benefit of the deployment and unnecessarily increase human reviewer workload.
Target: below 12% of total escalated volume.
c. Missed escalation rate
The percentage of cases the agent resolves autonomously that a qualified human reviewer would have escalated under the defined escalation criteria. A missed escalation rate above 3% in a regulated workflow is a compliance risk that requires immediate recalibration of the threshold.
Target: below 2%; for compliance-sensitive workflows, below 1%.
d. Hallucination rate
The percentage of agent outputs that contain factual claims, data values, or references that are not supported by the inputs the agent processed. In agentic workflows that produce structured outputs, hallucinations that enter downstream systems cause errors that are difficult and expensive to trace back to their source.
Target: zero on structured data outputs; below one percent on narrative outputs.
3. Efficiency and throughput metrics
a. End-to-end task latency
The elapsed time from task initiation to task completion or escalation, measured at the 50th, 95th, and 99th percentiles. The 50th percentile establishes the typical performance baseline; the 95th and 99th percentiles identify the tail latency behavior that determines the worst-case experience for operations teams and the end users they serve.
Target ranges vary by workflow type: invoice processing at under 60 seconds at the 50th percentile; complex research synthesis at under 10 minutes.
b. Tool call count per task
The number of tool calls the agent makes to complete a task, tracked as a distribution across the task population. An increasing tool call count over time in a stable workflow indicates either model drift or upstream data quality degradation, which forces more retrieval and validation steps. Establishing a baseline tool call distribution at deployment provides the reference point for detecting this degradation pattern.
c. Token consumption per task
Total input and output token count per completed task, which determines model inference cost at scale. Token consumption that increases over time without a corresponding increase in task complexity indicates prompt bloat, context accumulation errors, or retrieval inefficiency in the agent’s memory architecture.
Tracking this metric enables cost forecasting and identifies optimization opportunities before inference costs scale beyond projections.
d. Cost per completed task
Total infrastructure, inference, and tool call cost divided by the number of successfully completed tasks is the cost per completed task. It is the unit economics metric that determines whether the deployment’s cost structure is improving or degrading over time.
A cost per completed task that increases by more than 15% above the deployment baseline within the first 6 months indicates a systemic efficiency problem that requires diagnosis before the program scales to higher volumes.
4. Reliability and stability metrics
a. Error rate per integration point
The percentage of tool calls to each connected system that return an error, tracked separately per integration rather than as an aggregate. An aggregate error rate hides which specific integration is degrading. Per-integration tracking allows the maintenance team to identify and address failing integrations before they affect overall task success rates.
Target: below one percent per integration point in production.
b. Retry rate
The percentage of tool calls that require one or more retries before succeeding. A retry rate above five percent on a specific integration indicates either rate limiting, intermittent API instability, or a data formatting issue in the agent’s outgoing requests, each requiring a different resolution.
A rising retry rate in a previously stable integration is an early warning sign of an infrastructure problem before it becomes an outage.
c. Mean time between failures (MTBF)
The average elapsed time between incidents that require human intervention to resolve. Here, an incident is defined as a task failure or system error that the agent’s error-handling cannot address.
A declining MTBF indicates accumulating technical debt in the integration layer or degrading model reliability; an improving MTBF confirms that maintenance and retraining investments are having the expected effect.
d. Recovery time after failure
The elapsed time from failure detection to full restoration of normal agent operation, averaged across incidents in the review period. Recovery time of more than two hours in a critical production workflow indicates either insufficient monitoring coverage or an underdeveloped runbook for the incident type.
Target: below thirty minutes for incidents within the defined runbook scope.
5. Human-in-the-loop metrics
a. Escalation rate
This metric measures the percentage of total tasks that the agent escalates to a human reviewer, tracked weekly and compared against the shadow-mode baseline established in phase four of the deployment.
An escalation rate more than five percentage points above the shadow mode baseline indicates a data distribution shift, a model drift event, or upstream data quality degradation, each of which is visible in component-level metrics if the diagnostic framework is in place.
Target: within three percentage points of the shadow mode baseline.
b. Escalation accuracy
The percentage of escalations that the human reviewer confirms were correct escalation decisions. This metric measures the cases that genuinely required human judgment under the defined escalation criteria.
Escalation accuracy below 75% indicates miscalibrated confidence thresholds that unnecessarily send resolvable cases to human review.
Target: above 80% of escalations confirmed correct by human review.
c. Human override rate
The percentage of agent autonomous decisions that human reviewers subsequently reverse during quality assurance sampling. An override rate above five percent indicates a systematic difference between the agent’s decision logic and the operational standard the human team applies.
The lag may indicate a training data labeling issue, a policy change not yet incorporated into the agent’s decision criteria, or a workflow segment where the agent’s authority should be reduced pending retraining.
d. Time-to-human-resolution on escalated cases
The elapsed time from escalation to a human reviewer’s decision on escalated cases, measured at the 50th and 95th percentiles. This metric assesses whether the quality of the escalation handoff affects reviewer efficiency.
A decline in time-to-human-resolution after a change to the escalation handoff format is direct evidence that the change improved reviewer productivity.
| Metric | Definition | Target range | Warning threshold | What it diagnoses |
|---|---|---|---|---|
| Task success rate | % tasks completed correctly end-to-end | ≥ 90% | < 85% or 3pt drop in 2 weeks | Overall workflow health; model drift |
| Partial completion rate | % of tasks completed partially before failure | < 8% | > 10% | Step-level failure hotspots; planning logic gaps |
| Task abandonment rate | % tasks stopped without completion or escalation | < 1% | > 0% sustained | Error handling gaps; silent workflow failures |
| Decision accuracy rate | % autonomous decisions matching human ground truth | ≥ 92% | < 88% | Model quality; training data gaps; policy drift |
| False escalation rate | % escalations a human would have resolved autonomously | < 12% of escalations | > 15% | Over-conservative confidence thresholds |
| Missed escalation rate | % autonomous resolutions a human would have escalated | < 2% | > 3% | Under-conservative thresholds; compliance risk |
| Hallucination rate | % outputs with unsupported factual claims or data values | 0% structured; < 1% narrative | Any sustained non-zero on structured outputs | Model reliability; retrieval quality |
| End-to-end task latency (p95) | 95th percentile elapsed time from initiation to completion | Workflow-type dependent | Any 20% increase from baseline | Infrastructure degradation; model efficiency |
| Tool call count per task | Avg tool calls to complete a task | Stable distribution from baseline | Increasing trend over 4 weeks | Model drift; data quality degradation; prompt bloat |
| Cost per completed task | Total cost divided by successfully completed tasks | Stable or declining from baseline | > 15% above deployment baseline | Inference cost efficiency; scaling economics |
| Error rate per integration | % tool calls to each system return an error | < 1% per integration | > 2% on any single integration | API instability; auth issues; rate limiting |
| Escalation rate | % tasks escalated to human reviewer | Within 3pts of shadow mode baseline | > 5pts above shadow mode baseline | Data distribution shift; model drift |
| Escalation accuracy | % escalations confirmed correct by human reviewer | ≥ 80% | < 75% | Confidence threshold calibration |
| Human override rate | % autonomous decisions reversed by human QA | < 5% | > 8% | Decision logic gap; policy change not incorporated |
Benchmarks for Agentic AI in Enterprise Contexts
Benchmarks tell you where your agent sits relative to what frontier models can achieve on standardized tasks. The distinction matters because enterprise production performance consistently diverges from public benchmark scores, and programs that set expectations based on benchmark results without internal validation consistently face credibility problems when production metrics land lower.
1. Published agentic AI benchmarks and what they measure
Four published benchmarks have established relevance for enterprise AI teams evaluating agentic system capability. Each measures something real and useful; each also has specific limitations that determine how much weight it should carry in an enterprise evaluation.
a. SWE-bench
- What it is: SWE-bench is the leading benchmark for evaluating AI agents on real-world software engineering tasks. It tests whether an agent can resolve actual GitHub issues by reading code, identifying defects or missing functionality, generating a code fix, and passing the associated test suite.
- Why enterprises use it: SWE-bench is considered the most rigorous benchmark for software development agents because it evaluates end-to-end coding ability instead of isolated code generation. It is particularly valuable for organizations assessing AI agents for software engineering, DevOps, IT operations, and code maintenance workflows.
- Enterprise performance context: Frontier models achieve roughly 30–50% on SWE-bench (verified as of 2026). However, benchmark scores rarely translate directly into production outcomes. An enterprise development agent that scores 25% on SWE-bench while successfully resolving 80% of its target ticket types may still represent a highly effective production deployment.
b. WebArena
- What it is: WebArena evaluates an AI agent’s ability to complete realistic browser-based tasks, including navigating websites, interacting with enterprise web applications, managing calendars, and completing e-commerce workflows using a browser interface.
- Why enterprises use it: Many enterprise systems expose functionality only through web interfaces rather than APIs. WebArena therefore provides a practical measure of how reliably an agent can operate customer portals, internal dashboards, and other browser-based business applications.
- Enterprise performance context: Because its tasks closely resemble operational workflows, WebArena offers stronger real-world relevance than purely reasoning-focused benchmarks. Current frontier models typically score between 15% and 40%, illustrating the continued difficulty of dependable browser automation across changing user interfaces.
c. AgentBench
- What it is: AgentBench evaluates AI agents across multiple environments, including web browsing, database operations, operating system interaction, and knowledge retrieval. Rather than testing a single skill, it measures an agent’s ability to coordinate tools across diverse environments.
- Why enterprises use it: Enterprise AI agents rarely operate in isolation. They must retrieve information, interact with multiple applications, execute system commands, and work across databases and business tools. AgentBench provides a useful proxy for this cross-system orchestration capability, making it particularly relevant for multi-agent and enterprise automation scenarios.
- Enterprise performance context: Scores above 30% generally indicate broad tool-use competence suitable for enterprise deployment, while scores below 20% often signal reliability issues that are likely to emerge during production integration and testing.
d. GAIA
- What it is: GAIA is a benchmark for evaluating general-purpose AI assistants on realistic knowledge work. Tasks require agents to combine multi-step reasoning with web search, document analysis, and calculations to answer real-world questions.
- Why enterprises use it: Unlike benchmarks focused on coding or tool use alone, GAIA reflects the kinds of analytical and research-intensive tasks commonly performed by knowledge workers. As a result, it serves as a useful indicator of how well an AI assistant may perform in enterprise decision support, research, and business analysis workflows.
- Enterprise performance context: Human participants achieve approximately 92% on GAIA. Frontier AI models currently score between 40% and 70%, depending on task difficulty, highlighting the remaining gap between AI assistants and human performance on complex knowledge work.
2. Building internal benchmarks for your specific workflows
Published benchmarks establish what capable agents can do in general, while internal benchmarks establish what your specific agent does on your specific workflow. The difference between the two is where production surprises live, and closing it requires building a benchmark task set from your own operational data before production launch.
Step 1: Defining the benchmark task set
Select 200-500 representative cases from the historical production data of the target workflow, stratified to reflect the actual distribution of case types, input formats, and complexity levels the agent will encounter in production.
Step 2: Labeling ground truth
Each benchmark case needs a documented correct outcome, including the decision the agent should make, the actions it should take, and the final system state it should produce, established by qualified human reviewers.
Step 3: Setting performance floors
Define the minimum acceptable score on each benchmark dimension that the agent must reach before production launch and maintain in production to avoid a mandatory diagnostic review. These floors should be set conservatively.
For instance, a floor at 90% on-task success rate, with a warning threshold at 87%, gives the team time to investigate before performance degrades to a business-impacting level.
Step 4: Running benchmarks on a cadence
Run the internal benchmark monthly for the first six months of production operation and quarterly thereafter. Using the same benchmark task set each time to produce comparable scores across runs.
Benchmark scores that diverge from the production metrics tracked in the operational monitoring framework indicate either a data distribution shift or a benchmark task set that was not representative to begin with.
3. Production performance ranges by workflow type
The table below reflects documented performance ranges from enterprise agent programs in production across the workflow types covered in this guide. These ranges represent achievable performance.
Programs at the lower end of each range have either not resolved their data readiness issues or have deployed on a workflow type that is not yet ready for autonomous-agent handling.
| Workflow type | Target task success rate | Target escalation rate | Target p50 latency | Typical payback threshold |
|---|---|---|---|---|
| Invoice processing | ≥ 92% | < 8% | < 45 seconds | 800+ invoices/month |
| Contract data extraction | ≥ 88% | < 15% | < 3 minutes | 200+ contracts/month |
| Tier-1 customer service resolution | ≥ 90% | < 12% | < 90 seconds | 1,500+ contacts/month |
| Transaction monitoring and investigation | ≥ 94% | < 10% | < 60 seconds | 5,000+ transactions/day |
| Regulatory report assembly | ≥ 95% | < 5% | < 20 minutes | Monthly filing cycle |
| IT incident triage and first response | ≥ 88% | < 18% | < 2 minutes | 200+ incidents/month |
| Software code review | ≥ 85% | < 20% | < 5 minutes per PR | 50+ PRs/month |
| Supplier risk monitoring | ≥ 90% | < 12% | < 10 minutes | 100+ active suppliers |
Evaluation Best Practices for Enterprise Agent Programs
The instrumentation decisions made at deployment determine what a team can and cannot diagnose six months later. Evaluation frameworks retrofitted after production launch are significantly more expensive to build and always less complete than those designed into the agent architecture from the start.
1. Build evaluation into the agent architecture from day one
Evaluation infrastructure is not a monitoring layer added on top of the agent. Rather, it is a set of structured logging and instrumentation requirements that the agent architecture must satisfy from the first production deployment.
Four specific instrumentation requirements need to be designed in:
1a. Structured step logging
Every agent action, including each tool call, intermediate decision, retrieved document, and drafted output, is logged in a structured format with a consistent schema that allows programmatic analysis across the full case population.
Unstructured logs that capture what the agent did in free-text form are readable but not analyzable at scale. Structured logs with typed fields and consistent identifiers are required for the component-level diagnostic analysis on which root cause investigation depends.
1b. Confidence score capture
The agent’s confidence score for each autonomous decision is logged alongside the decision itself, enabling a calibration analysis that identifies whether the agent is systematically overconfident or underconfident on specific case types. Confidence scores without associated decisions are useless for calibration analysis; decisions without confidence scores make it impossible to optimize escalation thresholds.
1c. Tool call logging
Each tool call is logged with the input parameters sent, the response received, the latency of the call, and the success or error status separately from the agent’s reasoning about the result. Tool call logs are the primary data source for integration-level error rate analysis and retry rate monitoring; they are also the audit evidence for compliance reviews that verify that the agent accessed only the systems and data required by its task.
1d. Decision trace storage
The complete reasoning trace for each autonomous decision, i.e., the inputs considered, the intermediate conclusions reached, and the decision rule applied, is stored in a retrievable format for the audit log review cadence and for the human override analysis that identifies systematic decision logic gaps. Decision traces stored only in the model context, which is discarded after task completion, cannot be retrieved for audit or diagnostic purposes.
2. Run evaluation on a defined cadence
Reactive evaluation consistently identifies issues only after they have caused operational or compliance damage. A defined cadence ensures that degradation is caught at a magnitude where the diagnostic and corrective action is still straightforward.
- Weekly accuracy review: Measure task success rate, decision accuracy rate, escalation rate, and false and missed escalation rates reviewed weekly for the first three months of production operation. Any metric outside its defined tolerance will trigger a structured diagnostic review within forty-eight hours.
The first three months are the highest-risk period for post-launch performance degradation. Weekly reviews provide the detection sensitivity needed to catch problems before they compound.
- Monthly benchmark runs: internal benchmark should be executed monthly for the first six months. Compare current production performance against the benchmark baseline established at deployment.
A benchmark score declining by more than three percentage points from baseline triggers a model performance review to determine whether retraining is required. After six months of stable performance, the benchmark frequency transitions to quarterly.
- Quarterly business outcome review: Review cost per completed task, business KPI impact (processing time reduction, first-contact resolution rate, error rate reduction), and use case expansion readiness quarterly with program stakeholders.
3. Separate component evaluation from end-to-end evaluation
End-to-end workflow metrics tell you that something is wrong but component-level metrics tell you where. A program that monitors only end-to-end task success rate faces the diagnostic equivalent of knowing a patient has a fever without knowing which organ is affected. The symptom is clear, but the treatment requires additional investigation that takes time the production system does not have.
Each agent component should have its own test suite with its own performance baseline. When end-to-end metrics degrade, the component test suite is run first to identify which component’s metrics have changed, which reduces the mean time to diagnosis from hours of log analysis to minutes of targeted component testing.
4. How RTS Labs instruments enterprise agent evaluation
RTS Labs designs the evaluation architecture as a first-class deliverable of every enterprise agent deployment, covering structured logging schema design, confidence score capture, tool call instrumentation, and decision trace storage built into the agent from day one.
The evaluation framework includes component-level test suites for each integration point, an internal benchmark built from the client’s own production data, and a defined review cadence with documented escalation procedures for each warning threshold.
Ongoing evaluation support includes quarterly benchmark runs, annual evaluation architecture reviews as the agent’s workflow scope expands, and diagnostic support when production metrics trigger the review thresholds.
Read how RTS Labs engineered a scalable AWS data platform for its client with standardized reporting in 20 weeks, driving a 19% market share increase and pushing enterprise value past $3 billion.
Common evaluation mistakes to avoid
- Measuring task success rate without measuring decision quality: a task can be completed successfully while containing intermediate decisions that were incorrect but did not affect the final output. Task success rate without decision accuracy sampling misses the systematic quality problems that accumulate into compliance exposure.
- Using escalation rate as a proxy for accuracy: a low escalation rate means the agent is handling cases autonomously; it says nothing about whether those autonomous decisions were correct. A program with a three percent escalation rate and an eight percent human override rate on QA sampling has a quality problem that the escalation rate alone would never surface.
- Evaluating in staging on clean data and treating it as production validation: staging environments with curated, well-formatted test cases consistently overstate production performance by five to fifteen percentage points on task success rate. Shadow mode validation against real production data is the only evaluation that reflects how the agent will perform after launch.
- Setting evaluation cadence by calendar rather than by workflow risk level: a compliance-sensitive financial transaction workflow warrants weekly accuracy review and daily escalation rate monitoring; a low-stakes internal document routing workflow warrants monthly review. Applying the same cadence to all workflows either overinvests in monitoring low-risk agents or under-monitors those where degradation carries regulatory consequences.
The Future of Agentic AI Evaluation
Evaluation tooling is the least mature part of the agentic AI stack relative to the sophistication of the systems it is being asked to measure, and the difference is closing faster in 2026 than at any point in the previous two years.
The most significant development is the emergence of standardized evaluation frameworks, such as Microsoft Research’s AgentEval and the LangChain evaluation suite, specifically designed for agentic systems.
The deployment of automated evaluation agents, which can sample 100% of agent decisions, and the maturation of multi-agent system evaluation, which introduce evaluation challenges that single-agent frameworks do not address, are the two other significant developments.
Enterprises building multi-agent production programs are now defining the evaluation practices that will become standard across the industry as multi-agent architectures proliferate.
What RTS Labs Can Do for Your Organization
Agentic AI evaluation determines whether a program can be diagnosed, improved, and trusted to scale. RTS Labs builds evaluation architecture into every enterprise agent deployment from day one, designing the logging schema, instrumentation points, component test suites, and internal benchmarks that give programs the diagnostic capability they need before production problems become visible to stakeholders.
The full evaluation engagement covers metric selection and target range definition calibrated to your specific workflow type and risk level; internal benchmark development from your production data; structured review cadence design with documented escalation procedures; and ongoing diagnostic support when production metrics require investigation.
RTS Labs treats evaluation architecture as inseparable from agent architecture because programs that cannot measure what their agents are doing cannot reliably improve them, govern them, or justify expanding their authority.
Also Read: Agentic AI Governance Framework: From Policy Documents to Production Controls
Frequently Asked Questions (FAQs)
Q1. How many cases do we need to sample per review period to obtain statistically meaningful decision-accuracy measurements?
A sample of 100 cases per review period yields a margin of error of ±10 percentage points at 95 percent confidence, sufficient for directional monitoring. For compliance-grade accuracy claims, a sample of 400 cases reduces the margin of error to ±5 percentage points, the minimum recommended for such programs. Sampling should be stratified to reflect the actual case type distribution and not randomly drawn from the total volume.
Q2. What is the difference between task success rate and decision accuracy rate, and which matters more?
Task success rate measures whether the agent completed all required workflow steps correctly; decision accuracy rate measures whether each intermediate decision the agent made was correct. A task can succeed while containing incorrect intermediate decisions that did not affect the final output, but that accumulate into compliance exposure over time.
Q3. How do we handle evaluation for non-deterministic agent workflows where the same input produces different execution paths?
Evaluate against outcome criteria instead of execution-path criteria. Define the acceptable final states for each task type, including the correct system state, the correct output, the correct escalation decision, and score the agent on whether it achieves an acceptable final state, regardless of which specific execution path it took.
Q4. How does RTS Labs approach evaluation for multi-agent workflows where failures may originate in any of several agents?
RTS Labs instruments each agent in a multi-agent system with its own component-level evaluation suite, enabling agent-level failure attribution. Each agent’s outputs are treated as inputs to the next agent’s component evaluation, creating an end-to-end diagnostic chain where a workflow-level failure can be traced back to the specific agent and the specific decision that originated it within minutes of a diagnostic review being triggered.
Q5. At what point should a declining metric trigger a model retraining decision instead of a configuration adjustment?
Configuration adjustments, such as recalibrating escalation thresholds, updating retry logic, and modifying integration error handling, address specific, identifiable causes that do not require changes to the model.
Retraining is indicated when the decision accuracy rate declines across multiple case types simultaneously, when the internal benchmark score declines by more than three percentage points below the deployment baseline, or when the human override rate on QA sampling rises above eight percent and configuration changes have not resolved it within two review cycles.